Social media is a fountain of knowledge when it comes to public opinion. Activity on social media can affect anything from elections to the success of a film, to trust in a medicine or the popularity of a record. However, one of the obstacles is the vastness of the data available – which, for a machine learning or ML engineer, presents a tantalizing challenge.
As social media is such a valuable resource for measuring public mood, there are various ways it could be used to measure or predict economic trends. Economics, after all, depend very much on people’s attitudes and spending habits. An umbrella term for these trends and effects is consumer confidence, which currently, is measured using time-consuming and costly surveys. But, with a vast resource like social media apparently so readily available, could an ML engineer design an algorithm to measure consumer confidence online?
This was the question I asked myself before embarking on my Master’s thesis project in Statistics for Data Science. Here, I share the process and findings behind my research into whether or not I, as an ML engineer, could design a reliable tool to measure consumer confidence on social media. I’ve tried to explain as simply as possible for the benefit of non-experts while retaining a sufficient amount of detail.
Table of Contents
Why consumer confidence?
First off, some definitions: what is consumer confidence exactly? Consumer confidence indices are used by policymakers, investors, market researchers, among others, to make decisions. The consumer confidence index is a key indicator of the overall health of the economy. When people feel confident about the stability of their incomes, it influences their spending and saving activities, which in turn, impacts other aspects of the economy.
According to Business Administration professor Seunghee Han, consumer confidence effectively reflects the intention of buying something. This is an ‘incidental emotion’, which are the emotions that carry us to the decision that have nothing to do with the decision itself. This is, naturally, extremely difficult to measure – however, social media may provide important insight.
But how could an ML engineer extract this abstract information from the oceans of data available on Twitter, Instagram, and Facebook? Machine learning has long been used to make sense of this vast amount of data; so, I set to work designing an algorithm that could detect this elusive indicator. Below, I’ll go into how this was done.
A summary of the method
In order to test this theory, I performed a social media sentiment analysis over a dataset of tweets from Spanish consumers. I trained supervised machine learning algorithms using corpus linguistics (in other words, “real-life” text), which was followed by a comparison study among a selection of some of the most-used algorithms in text mining literature. Each tweet was then classified by its polarity, using the classification model with the highest accuracy. I then drew up the consumption index and compared it with official consumer confidence statistics from the Spanish government. Let’s drill deeper into the process.
How the dataset was gathered by a ML engineer
As introduced, the aim of the project was to measure consumer confidence in Spain. Therefore, my dataset had to be a list of Spanish Twitter users. This meant we had to identify relevant accounts, which began with finding the most followed accounts in Spain. A users’ loop was applied to these accounts’ followers lists, followed by a location filter. I then took a random sample to limit the dataset to 240,000 users. This raw tweets dataset was downloaded, cleaned, transformed and filtered, to leave me with an accurate dataset of 40 million tweets (around 12GB of data).
The next phase was to select a time period. I used the five years prior to the start of the project to make the findings as relevant as possible. I then chose three days of the week, as this selection is most likely to reflect the pattern of official surveys. This was important to prove the usefulness of the algorithm, as I wanted to be able to make a clear comparison between official sources and my own findings.
Selecting the sentiment classification model
In order to identify the most useful sentiment classification model, I compared four commonly used text mining algorithms: lexicon, Bayes, support vector machines, and elastic-net regularized logistic regression. I’ll briefly outline what each of these entails before looking at the testing.
- Lexicon approach
This method measures the sensitivity of each tweeted word using a dictionary as a reference, known as lexicon. Once all the words are classified according to a numeric value, it adds them all up to assign a polarity score to the tweet.
- Naive Bayes
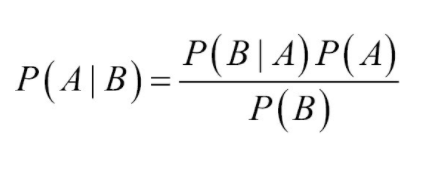
This supervised machine learning algorithm is based on the Bayes theorem:

This algorithm calculates the probability of a class (A) of sentence being conditioned to its features (B). The parameter to optimise is the weight given to the features “P(B)”.
- Support vector machines
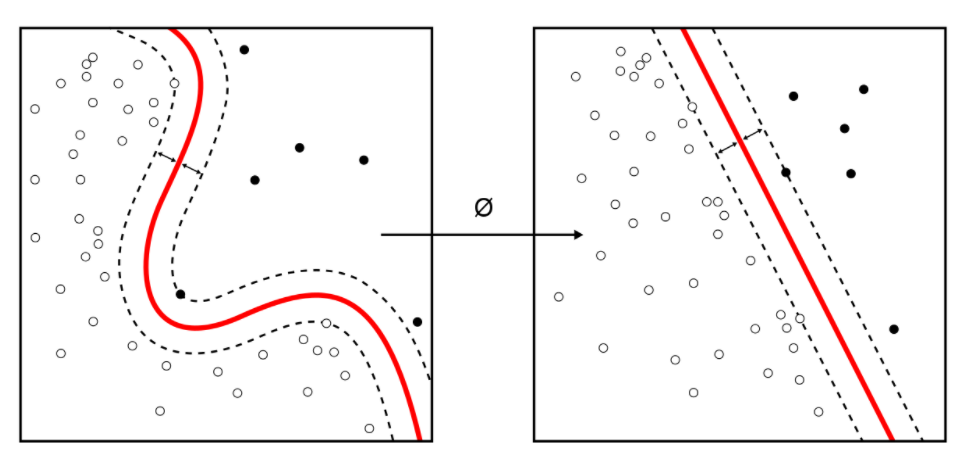
Support vector machines are commonly used algorithms in classification tasks. This method plots the words in the space (points), where the axes are the classes. The algorithm creates the frontier which better segregates the classes, which are in this case binary. The parameters to optimise are the kernel and the softness.

- Elastic-net regularized logistic regression
This algorithm predicts the probability of a tweet belonging to a certain class by regressing the words of a tweet, using the logistic function. Regularisation consists of finding the optimal complexity of the model. The parameter to optimize is “lambda”.

Learning and testing
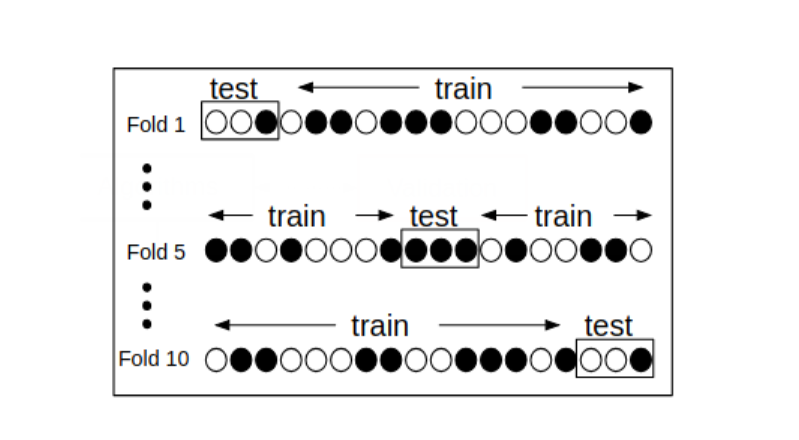
Using these approaches, I performed a split validation procedure over the corpus linguistics, expressed in the diagram below. I refined this technique thanks to the TASS workshop, convened by the International Conference of the Spanish Society for Natural Language Processing. It consists of a dataset of 70,000 pre-classified tweets.

In simple terms, the training set is used to feed the classification model and the test set is used to check its accuracy.
Validating the model
The classification model was found to have two main problems:
- The model could perform well on a sample (training set) but not outside of these parameters. This problem is called “over-fitting”. To avoid this issue, I performed 10-fold cross-validation. This is illustrated in the diagram below.
- The model had a tendency to discriminate between classes. To mitigate this possibility, I used the AUC criteria, which measures whether positively classified tweets are ranked higher than negatives.

Performance assessment
To check the accuracy of the different models, I applied the accuracy metrics to a confusion matrix. The results suggested that the classification model with the best performance was the logistic regression.

Building the index
With the model selected, the next step was to build the index. The classifier gives a label to each tweet, marking it either positive or negative. From this process, the day’s sentiment is calculated. Of course, there is a margin for error; some days may fall on weekends, bank holidays, or other religious holidays. These events could affect incidental emotion, and to mitigate this effect, I used a regression with a dummy variable.
To plot a monthly observation, I joined the sentiment of three days using a weighted mean. However, even with this averaging, the index is highly volatile. Previous studies have recommended smoothing, and as such, I applied Holt-Winters simple exponential smoothing. This method is useful because it uses past observations to calculate the present predicted values. It’s worth noting that although moving averages are commonly used, they use future observations to calculate the present value. Even the Kalman filter could be another option, but this approach was out of the scope of the project.
Reading the results

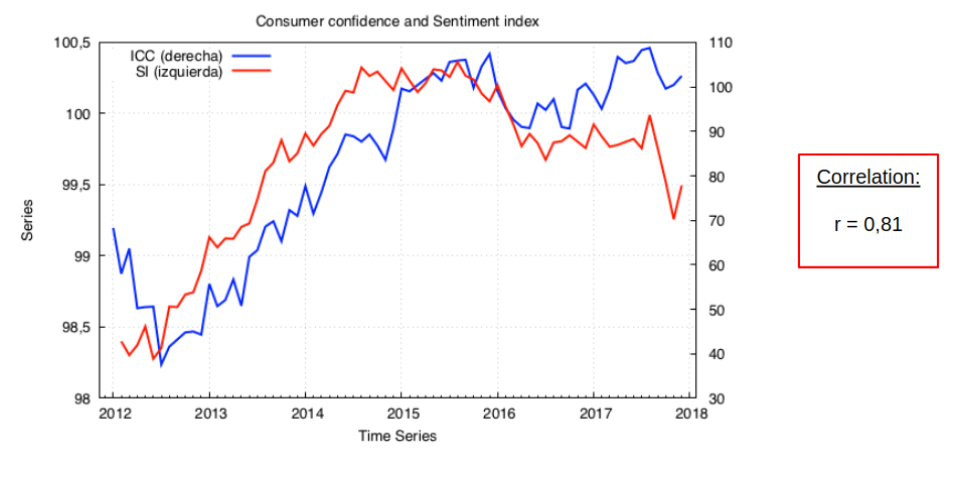
I used Pearson’s correlation coefficient to measure the relation between the sentiment index and consumer confidence, illustrated above. The result may indeed be a spurious correlation, but this study didn’t aim to find causal effects between the indices, but instead to check if there is evidence of the same phenomena.
The blue line corresponds to the official Spanish consumer confidence index and the red line to the performed index. As is clear, both these indices behave very similarly.
The case for the model
As we can see from the correlation between social media sentiment and official statistics, there is a strong case that consumer confidence is reflected in social media, despite the limitations of the project. The key advantage here is that compared to traditional survey methods, this approach is far cheaper and faster to perform, requiring just one ML engineer as opposed to a team of surveyors.
These tools offer the possibility for an even more granular approach to measuring consumer confidence. For example, governments or businesses could calculate regional indexes or even carry out weekly, daily, or streaming indexes. When it comes to corporate strategy or public policy, these are invaluable insights, as they could give decision-makers a laser-like view on when and where to implement projects, products, policies or launches.
Hire an ML engineer
If you’re looking for an experienced ML engineer like me, the Outvise marketplace is where to find them. I and thousands of other experts in machine learning, statistics, and artificial intelligence from all over the world are available for remote and onsite projects. Plus, Outvise has implemented an ingenious machine learning algorithm of their own to match projects with experts instantly and deliver high-quality, certified candidates in less than 48 hours.
Click here to explore the portfolio and find an ML engineer for your project.
Data Scientist. MSc Statistics for Data Science.
He describes himself as tenacious, brave and perseverant, but also a charismatic, outgoing and friendly person. He loves to spend time with his family and good friends. He has been very curious his whole life and he loves to learn new things. He has tried many jobs, started three degrees, and he finally found his passion, the world of data.


No comments yet
There are no comments on this post yet.